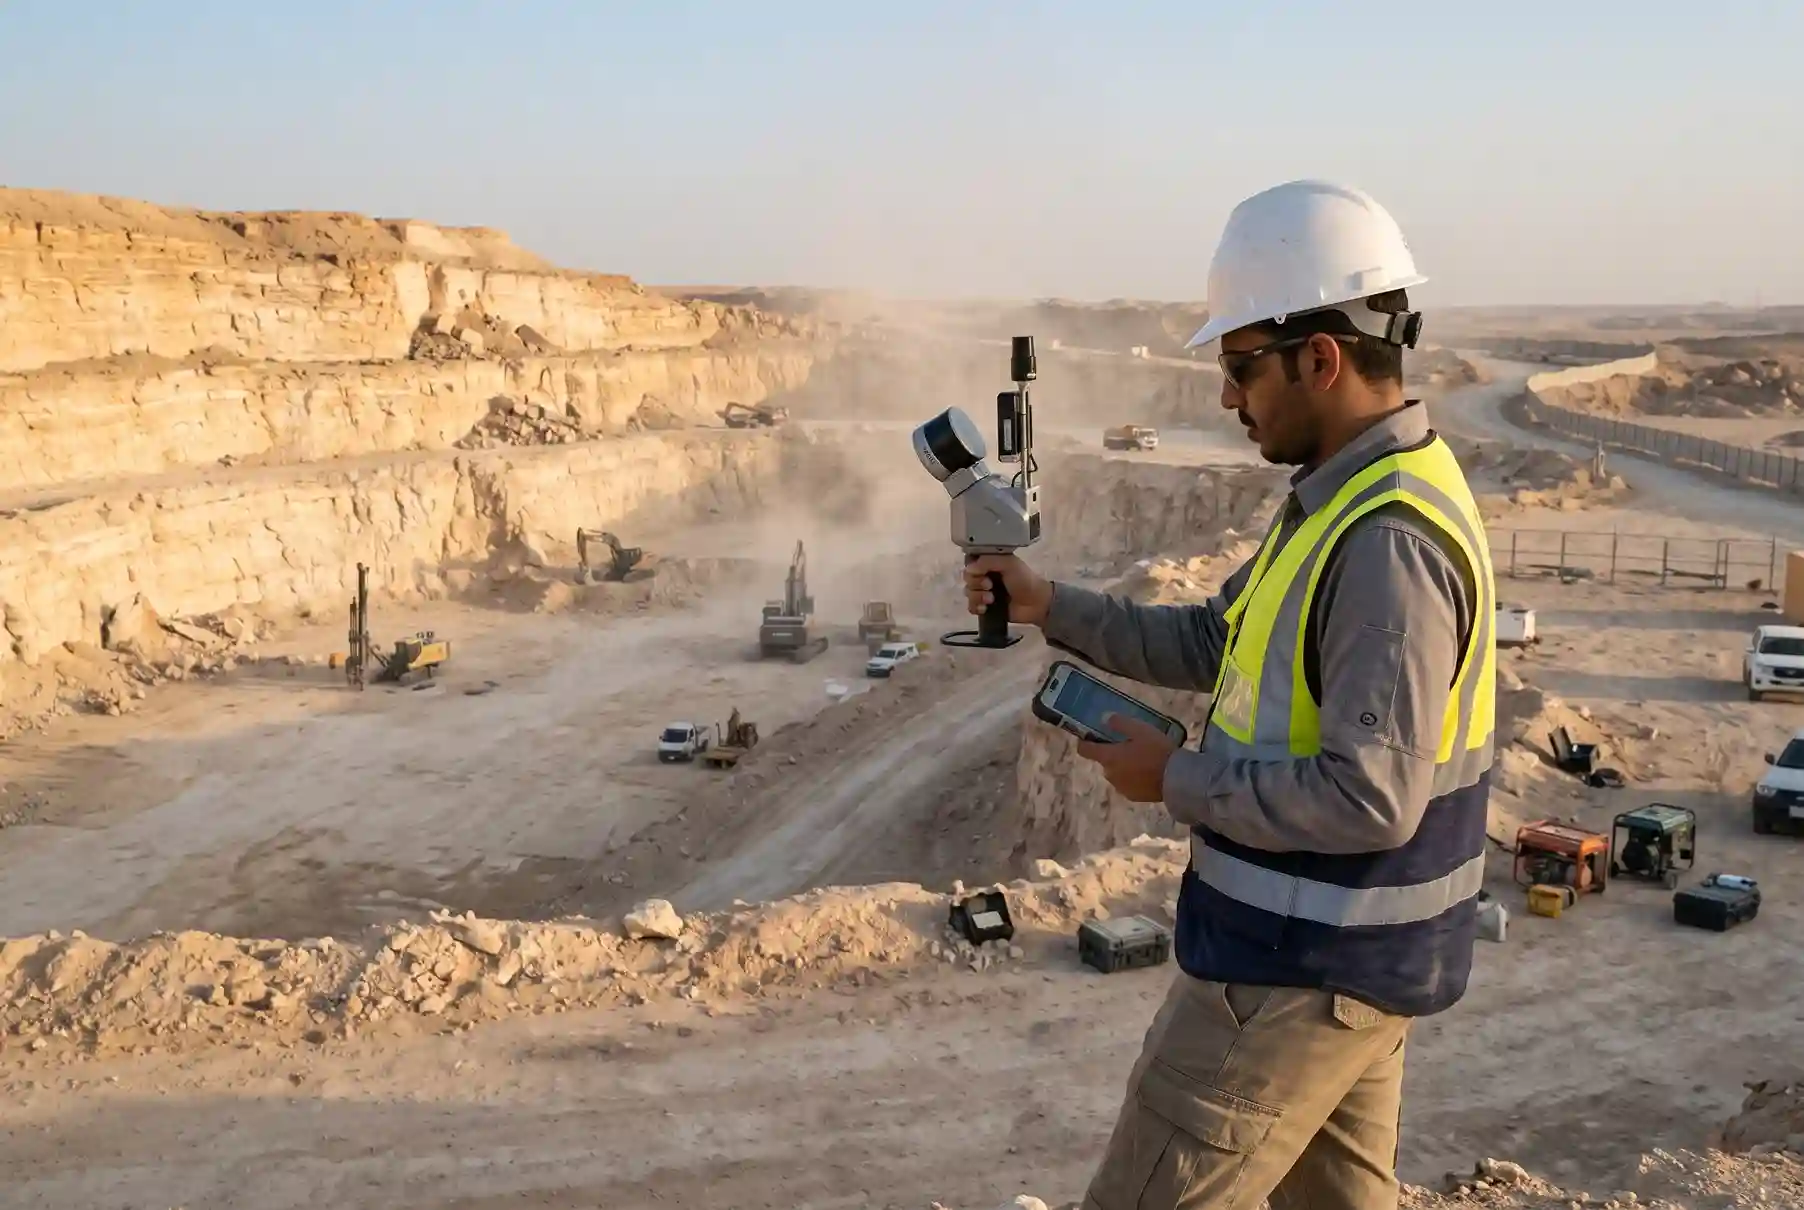
A 2025 basalt quarry study found that 2D readings at the toe were more than double the burden measured in 3D. A blast designed on the wrong burden starts with the wrong numbers.
A handheld LiDAR quarry survey fixes that. A surveyor walks the bench with a scanner and builds a 3D model of the quarry face before the drill rig moves in. The blast engineer then designs on what the face looks like today, not on what it looked like last month.
This article is for limestone, cement, aggregate and dimension stone quarries. It covers where face data goes wrong, how a three-step workflow works, what it means for safety and cost, and how to decide if it fits your quarry.
One limit up front. Handheld LiDAR is for the bench face. Large-area pit mapping and stockpile volumes are better done by drone, so we do not cover them here. Exploration, crushing, kiln and cement processing are also out of scope.
Why Quarries Need Better Face Data Now
Demand sets the pace for a quarry. When cement sales rise, quarries blast more. When sales fall, every blast has to earn its cost.
Saudi producers sold 13.13 million tonnes of cement in Q2 2025, up 21% year on year, and local sales made up 97% of the total. The report links much of that demand to megaprojects.
Demand has cooled since then. Saudi cement sales fell 8% in September 2026, to 4.4 million tonnes from 4.8 million tonnes a year earlier.
Both swings lead to the same need. When volumes are high, a quarry cannot afford blasts that break badly and slow the crusher. When volumes are low, a quarry cannot afford blasts that waste explosives or force rework.
In both cases, the blast should match its design. That depends on knowing the real shape of the face when the holes are drilled. Fences, tapes and a quick look from the crest do not give you that.
Where Face Data Goes Wrong at the Quarry Face
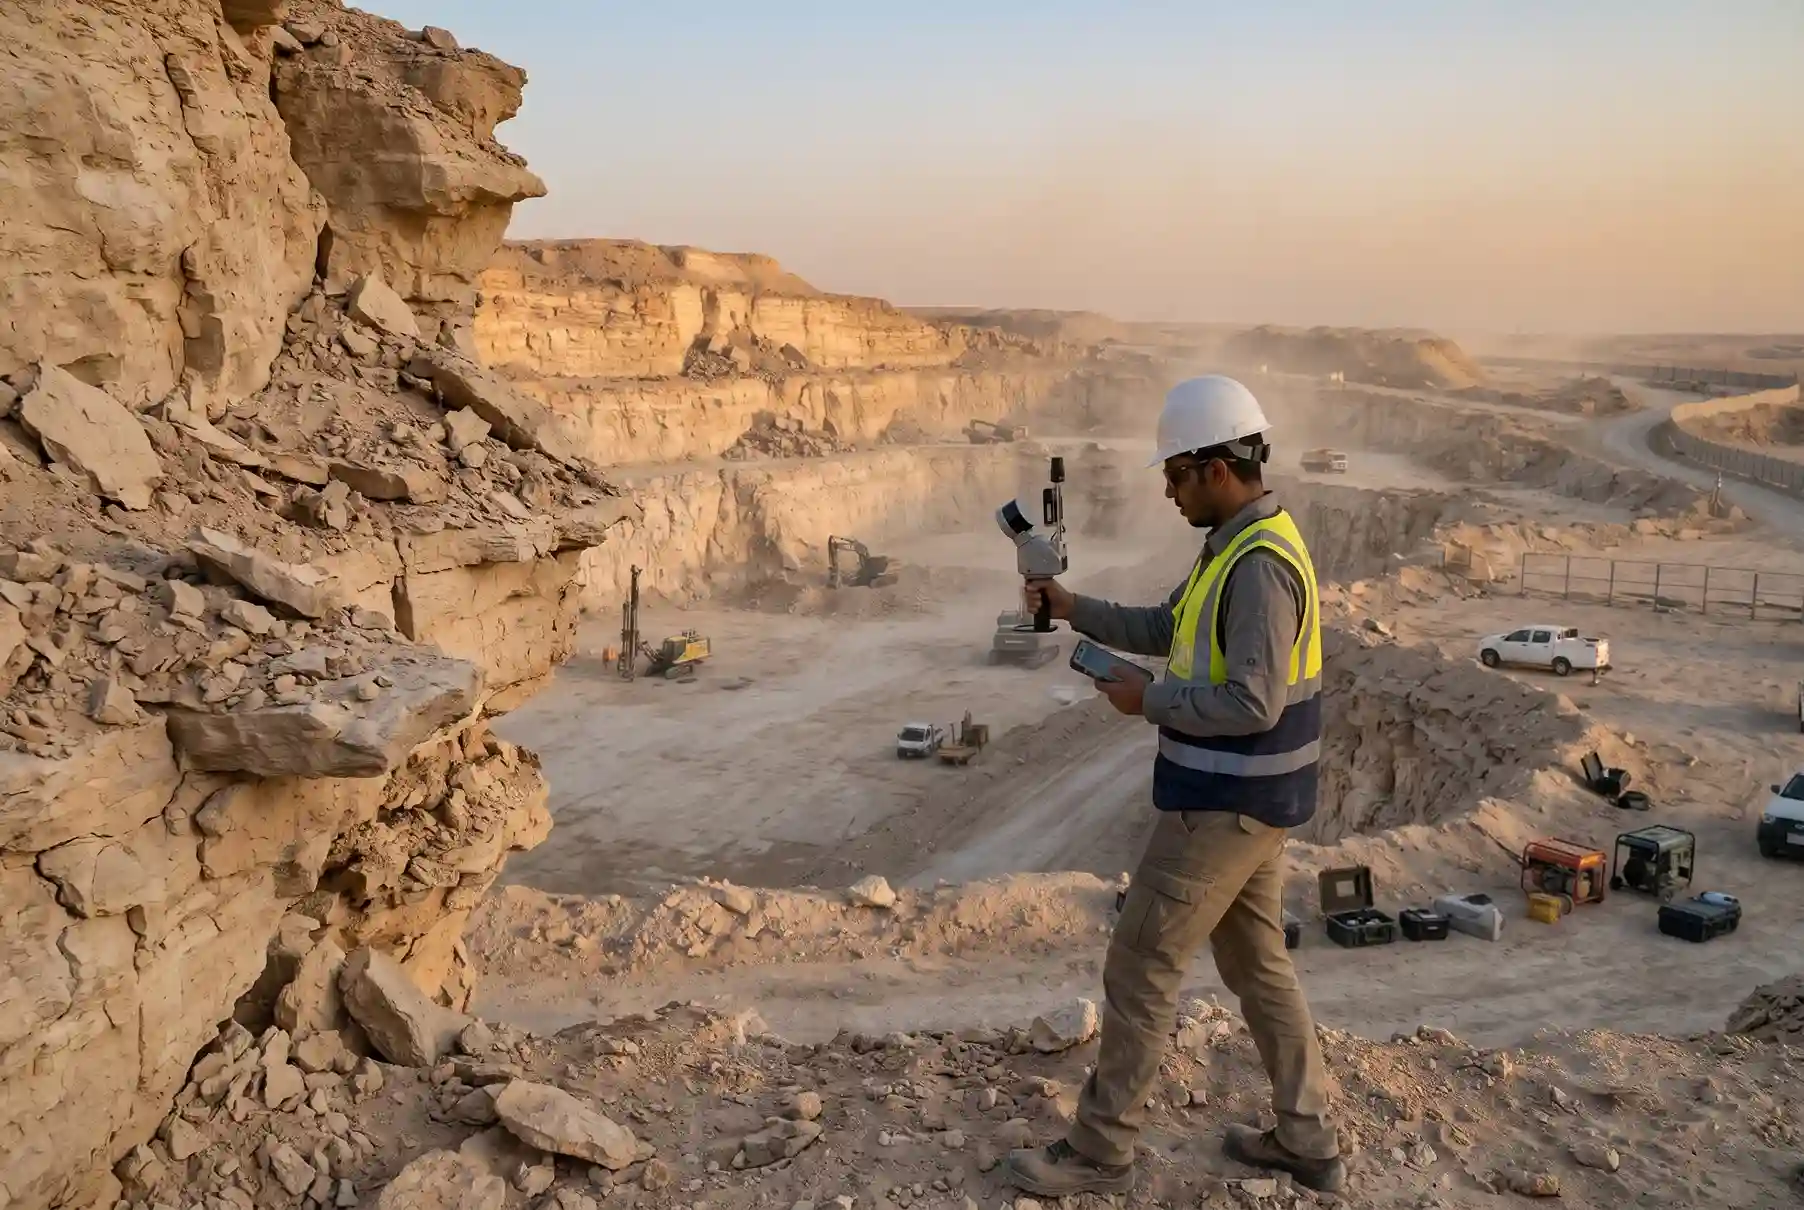
Most data problems come from three places: burden and toe, overhangs, and old data.
Burden and toe
Burden is the distance from a blast hole to the free face. It decides how the rock moves when the charge fires. Too little burden and the rock can fly past the blast area as flyrock. Too much burden and the rock breaks poorly.
The face is rarely a straight wall, so the burden changes from hole to hole. The basalt quarry study found burden differences of more than 100% between 2D and 3D measurements. In the toe zones, the 2D value was more than double the actual 3D burden.
The study used drone photogrammetry, not handheld LiDAR. The point is the same. A 2D reading hides how the face really looks, and a 3D model shows it.
Overhangs and face shape
Overhangs are hard to see from the crest. So is back-break from the last blast. A tape or a rangefinder gives you a few points, and the shape between those points stays a guess.
Where a face leans out over the toe, a hole drilled on the planned line can end up with far less burden than the design says. That is a safety problem as well as a breaking problem.
Old face data
A face changes with every blast. A design made on last month’s survey describes a face that no longer exists. The older the data, the more the hole pattern drifts from what the face needs.
This is why a quick, repeatable scan matters more than a perfect one. A scan you can repeat before each blast keeps the design current. A scan that takes a full day gets skipped.
Handheld LiDAR vs Other Survey Methods
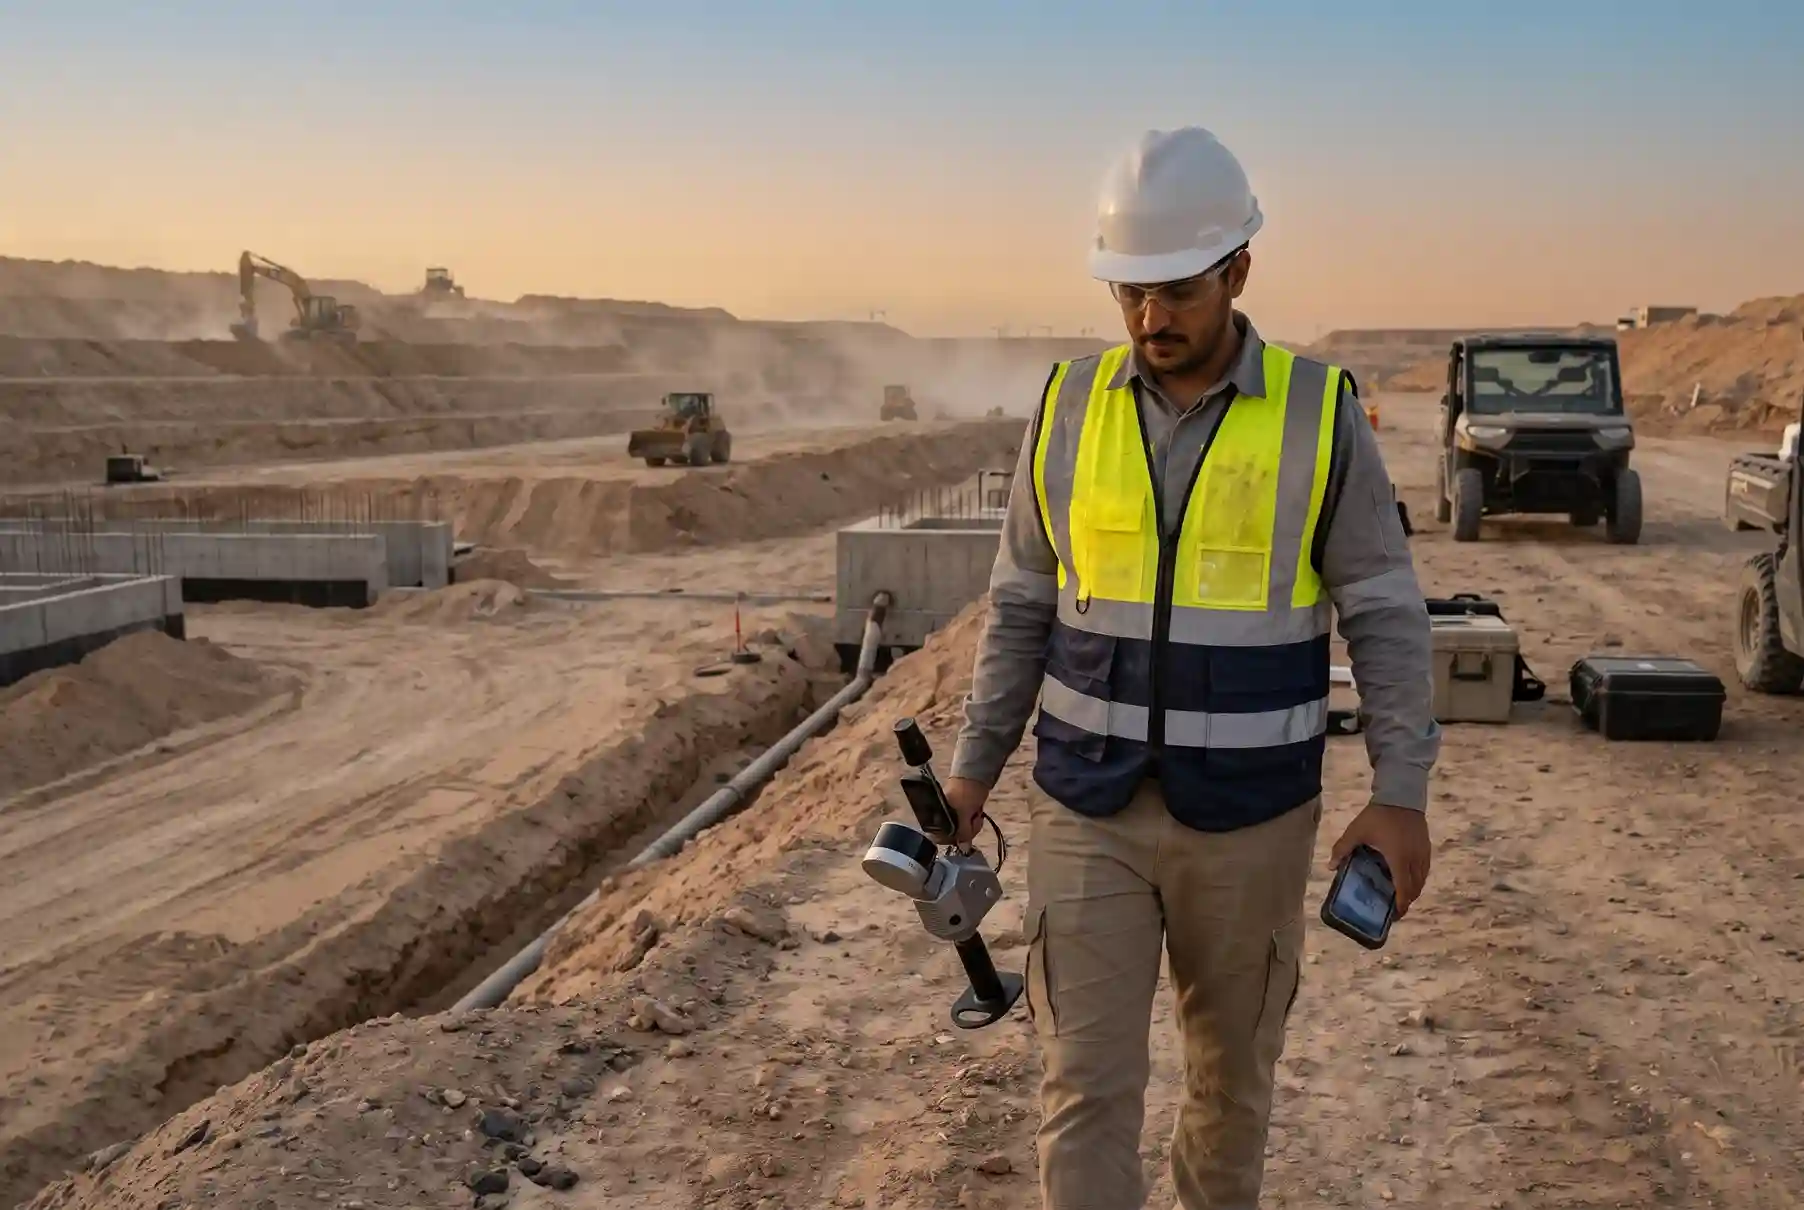
Handheld SLAM LiDAR means one person walks the bench and the scanner builds the 3D model as they move. SLAM stands for simultaneous localization and mapping. There are no tripod stations to set up and move.
Speed is the main reason quarries look at it. A 2023 test at a stone quarry site in Japan gives scan times for 10,000 m²: about 40 minutes for a handheld Leica BLK2GO, 90 to 120 minutes for a Topcon GLS-2000 tripod scanner, and 240 to 300 minutes for a Leica BLK360.
The same paper reports a height error of 0.8 cm for the handheld scanner, against 0.7 cm and 0.6 cm for the two tripod scanners. So handheld scanning was faster with only a small difference in accuracy in that test.
Be clear about the limits too. The test site was a flat archaeological quarry, not a blasting face, and the scanners were not the ones we use.
Cost is a different question. The 2025 basalt quarry study priced a laser total station at USD 40,000 to 55,000 (about SAR 150,000 to 206,250), plus USD 4,000 to 6,000 for software (about SAR 15,000 to 22,500), at USD 1 = SAR 3.75. That study compared the total station with a drone. It gave no price for handheld LiDAR, so we do not claim handheld LiDAR is cheaper.
| Method | Best for | Limit |
| Handheld SLAM LiDAR | Bench faces, crest and toe, quick re-scans | Covers a bench, not a whole pit |
| Total station | Single points and control | Slow for the full shape of a face |
| طائرة بدون طيار | Large-area pit mapping, stockpile volumes | Not the tool for a close face scan |
The three methods work together. A drone maps the whole pit and measures stockpiles. A total station or RTK GNSS sets control. Handheld LiDAR covers the face you are about to drill.
The FJD Trion P1 and Trion S2 are suitable for this work. The Trion P1 weighs 1 kg and reaches 70 m on bright surfaces (80% reflectivity) and 40 m on dark ones (10% reflectivity). The Trion S2 reaches 120 m in the Standard and PRO models and 300 m in the MAX model on bright surfaces, and 80 m on dark ones.
Both scanners have a built-in RTK module, so scans can be tied to survey control. Both report RTK accuracy of 8 mm + 1 ppm horizontal and 15 mm + 1 ppm vertical, and both support PPK.
| Trion P1 | Trion S2 | |
| Range, bright surface (80%) | 70 m | 120 m (Standard, PRO); 300 m (MAX) |
| Range, dark surface (10%) | 40 m | 80 m |
| Relative accuracy | Up to 2 cm | 1 cm or better |
| Absolute accuracy | Not stated | ٣ سم |
| Point rate | 200,000 points/second | 320,000 (Standard); 640,000 (PRO, MAX) points/second |
| Field of view | 360° × 59° | 360° × 270° |
| Battery life | 2 hours | 3 hours (one set of two batteries) |
| Weight | 1 kg (without camera and baseplate) | 1.8 kg (without battery, camera and GNSS module) |
| Operating temperature | -10 °C to 45 °C | -20 °C to 50 °C |
The S2 reaches farther, so it suits taller faces and wider benches. The P1 is lighter, so it is easier to carry along a long bench.
The 3-Step Workflow
The workflow has three steps: scan the bench, build and check the face model, then send the hole data to the rig. A post-blast scan closes the loop.
Step 1. Scan the bench crest and toe
A surveyor walks the bench crest and toe with the handheld SLAM scanner. The scanner records the face as the surveyor moves, so there is no need to climb the face or set up stations along it.
The scan is tied to control points with RTK GNSS. This places the scan in the quarry’s coordinate system, so the face model lines up with the blast design and the rest of your survey data.
This step captures the face in one walk along the crest and toe. The FJD Trion S2 has a 360° × 270° field of view and records 320,000 to 640,000 points per second, depending on the model. One set of two batteries runs about 3 hours.
The FJD Trion S2 reaches 120 m on bright surfaces (80% reflectivity) in the Standard and PRO models, and 300 m in the MAX model. On dark surfaces (10% reflectivity), range drops to 80 m in all three. Relative accuracy is 1 cm or better, and absolute accuracy is 3 cm. An RTK module is built in, and PPK is supported.
Walk the crest and toe by the quarry’s own safety rules. Keep a safe distance from the edge, and scan from where the surveyor can stand safely.
Step 2. Build the 3D face model and profile it
Next, build the 3D model from the scan and cut profiles along the face. A profile is a slice through the face that shows its shape from the top of the bench to the toe.
Then check the model against the quarry plan: the crest and toe lines, the bench width, the face angle, and any overhangs. If the real face does not match the plan, the planning team sees it here.
The surveyor hands over three things: the 3D face model, the profiles, and a short list of problem spots.
Step 3. Deliver the data and keep a baseline
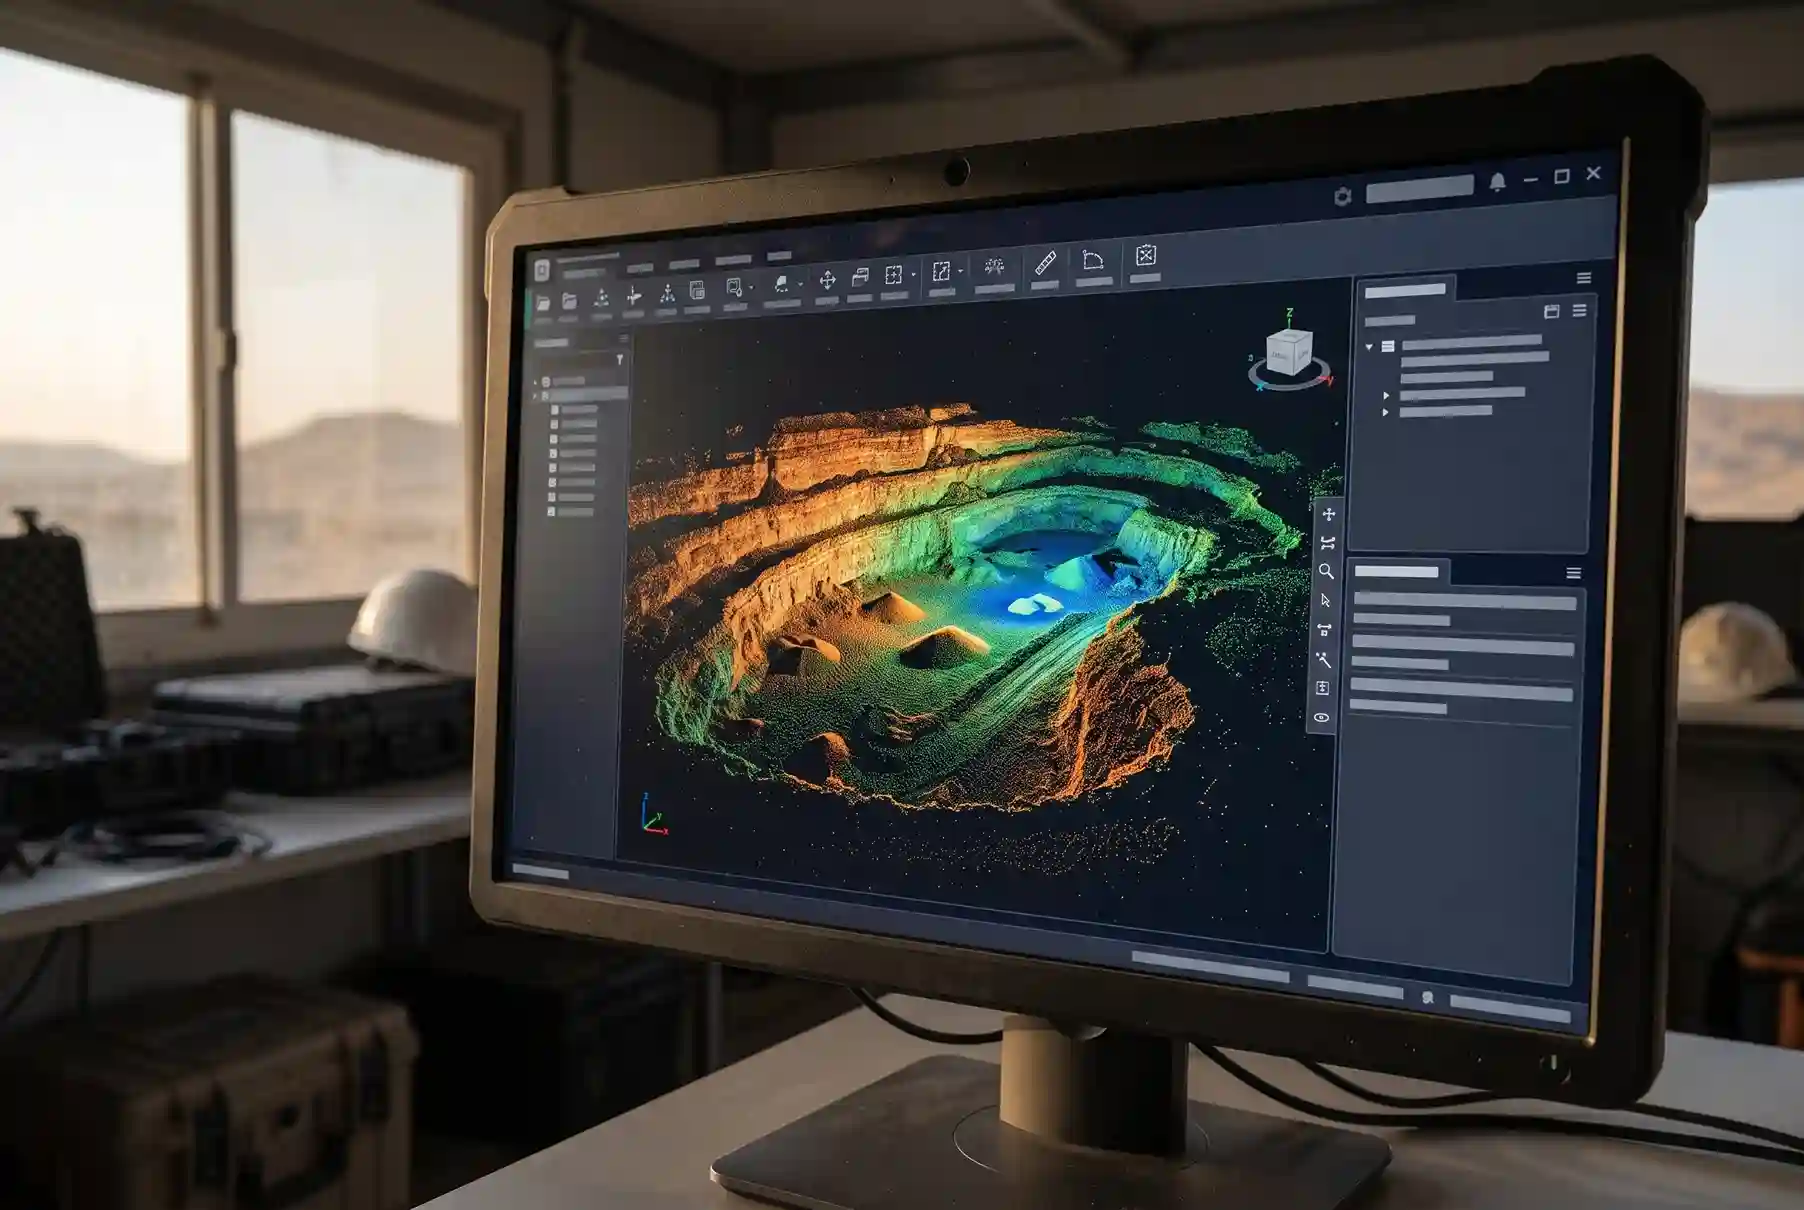
The last step is to deliver the data in a format the planning team can open. You receive the 3D point cloud, the profiles along the face, a 3D surface model of the bench, and plan drawings. The FJD Trion S2 exports point clouds as .las, .ply, .pts and .e57 files, so the data opens in common survey and design software.
Keep the first scan as a baseline. Scan the same bench again as the quarry develops, and compare the scans to see what has changed. Every scan after the first is checked against the one before it.
Safety on the Bench
Every hour a person spends near the face adds risk. A handheld scan can keep the surveyor at the crest and toe instead of on the face.
Pit & Quarry’s unofficial 2025 count was 33 US miner deaths, up 27% from 26 in 2024. The count was as of 5 January 2026, and MSHA had not yet issued a final total.
Three of those deaths involved a fall of face, rib, side or highwall, or explosives. Two were falls of face, rib, side or highwall, and one involved explosives.
Read the number with care. The count covers all US mining, including coal. Most deaths came from other causes, led by powered haulage at 13. So it is a reminder of how serious face and blast work is, not a measure of what scanning prevents.
Scanning does not replace bench safety rules. It does not stop a face from failing. What it does is cut the time people spend close to the face while you collect the data. We make no claim about how many deaths it prevents.
What Better Blast Design Is Worth
A survey does not cut cost by itself. Better design does. The survey gives the design a current face to work from.
One case shows what better blast design can do. At the Candelaria copper mine in Chile, drill and blast cost fell 16% over 10 months against a January 2024 benchmark, with about 20% less powder and fragmentation maintained.
That is one copper mine, not a quarry, and the case study comes from an explosives manufacturer. The savings came from matching explosive energy to the rock, not from scanning.
It still shows why the face model matters. Better design needs better inputs, and an up-to-date face model is one of them. A quarry that blasts on old data cannot make these gains.
The figure is a percentage, so there is no SAR conversion. Do not read it as a typical result for a quarry.
Is It Right for Your Quarry?
Handheld LiDAR does not suit every quarry. Check these three things first.
Your blast cycle
Do you blast often enough for fresh face data to matter? The more often you blast, the faster the face changes, and the more a current scan is worth.
Your faces
Tall, uneven faces with overhangs gain the most. A low, straight face with a clean toe may not need more than a rangefinder and a few points.
Your rigs and team
Can your drill rigs take imported hole data? And who will build the model and check it against the design? A scan with no one to use it saves nothing.
Use this checklist before you start:
- How often do you blast, and how much does the face change between blasts?
- Do your faces have overhangs or an uneven toe?
- Do your drill rigs take imported hole coordinates and surfaces?
- Who builds the 3D model, and who checks it against the blast design?
- How will you tie scans to control, and do you have RTK GNSS?
- Will you scan after each blast so the next design starts from the real face?
One more point on the alternative title. A handheld scan is not a drone flight, so the scan itself does not need a drone permit.
خاتمة
The workflow is simple. Scan the quarry face, check it against the blast design, send clean hole data to the rig, and scan again after the blast.
The reason is the one we started with. In the basalt quarry study, 2D readings at the toe were more than double the burden measured in 3D. A design built on that reading starts wrong, and a 3D model of the face corrects it.
If you want to see how a handheld LiDAR scan would work on your bench, let’s talk about it.

 العربية