
Riyadh’s extreme summer heat creates severe thermal stress, making massive urban forestry projects a critical challenge for local engineering teams.
To combat this climate setback, the Green Riyadh initiative spans 545 square kilometers with a mandate to plant 7.5 million trees across the capital by 2030.
According to environmental impact data, this intensive urban forestry drops surface heat reflection by 8°C to 15°C and lowers ambient air temperatures by up to 15°C through active shade and moisture release.
Furthermore, successfully lowering the city’s ambient temperature is projected to cut municipal energy consumption by 650 gigawatt-hours annually due to a massive reduction in air conditioning demands.
However, keeping millions of young saplings alive during peak summer remains a massive operational hurdle.
Traditional visual ground inspections cannot spot dehydration until the damage has already occurred, leading to high plant mortality rates.
Tracking the Invisible Signs of Plant Drought
Waiting for visible signs like browning leaves or drooping branches is a flawed strategy for land managers.
Visible damage indicates severe, irreversible cellular breakdown that makes plant recovery highly unlikely.
In the extreme summer climate of the Gulf, a sapling that shows visual signs of drying out is often already past the point of saving.
Replacing dead trees increases the financial burden on urban forestry projects and stalls regional environmental progress.
Human eyes can only see light in the visible spectrum, which reflects off the surface of the leaves.
This leaves asset managers completely blind to the early stages of dehydration occurring within the plant’s internal tissues.
Inside the Plant’s Defense Mechanism
To understand how technology solves this problem, we must look at the basic biological response of a tree under heat stress.
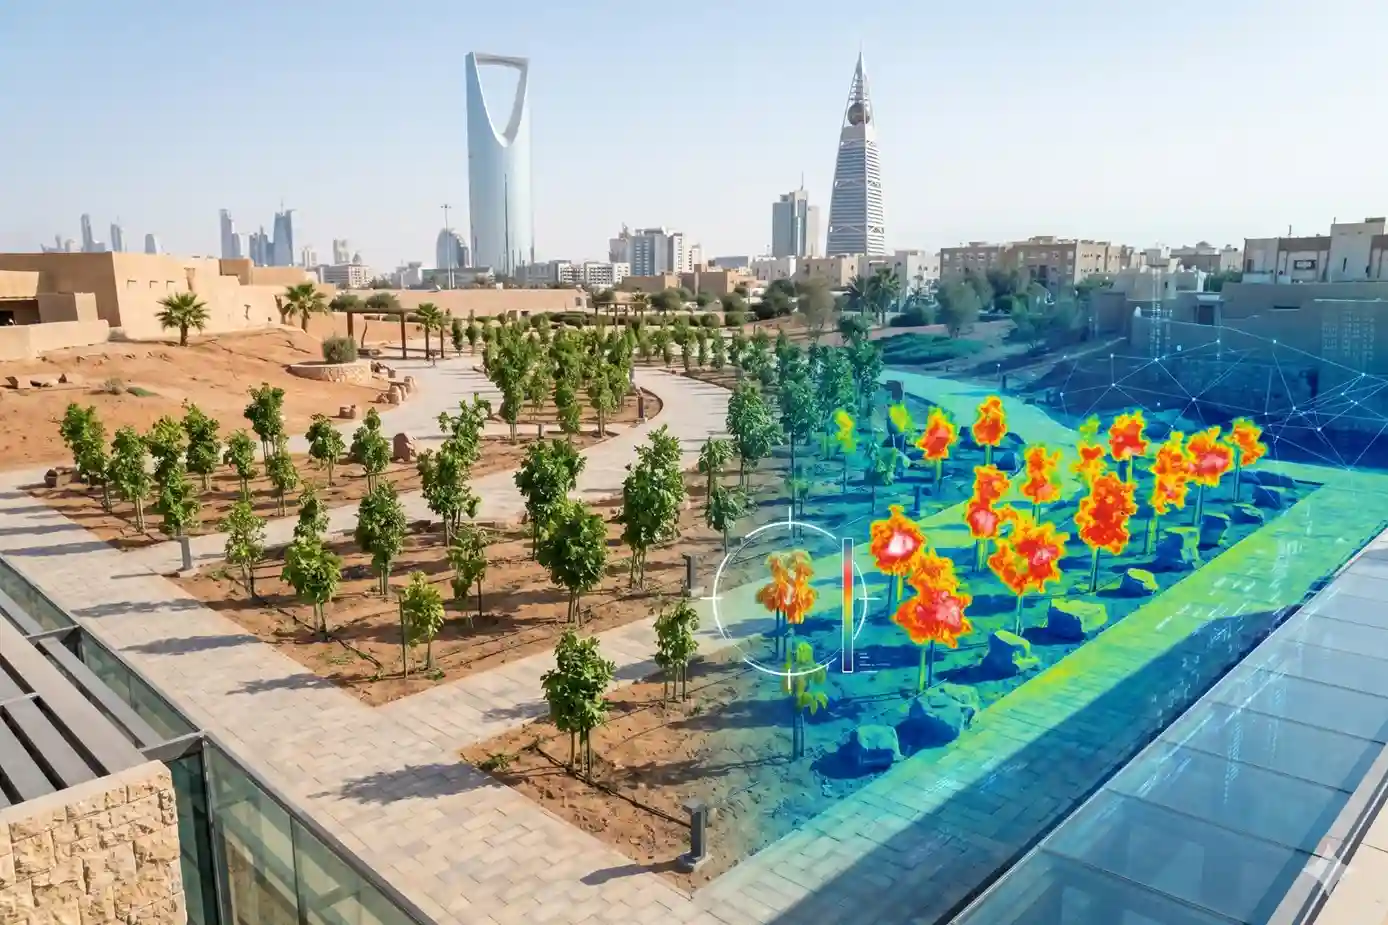
When a tree sapling experiences water stress, it immediately closes its stomata to trap moisture.
This protective measure slows down plant transpiration and causes its canopy temperature to spike immediately, providing a clear data signature before the plant actually dies.
This thermal change happens internally long before the physical structure of the leaf begins to collapse or lose its green color.
At the same time, the cellular structure inside the leaves starts to alter how it scatters light.
As chlorophyll production begins to slow down, the leaf’s ability to absorb and reflect specific invisible light wavelengths shifts noticeably.
The Pre-Symptomatic Window
This biological shift creates an invaluable window of time for irrigation technicians to react.
Advanced multispectral mapping sensors can detect biophysical plant changes and water shortages 2 to 7 days before any visual symptoms (such as drooping, yellowing, or leaf browning) are visible to the human eye.
This early detection window allows municipal landscaping teams to intervene with targeted irrigation while the root systems are still healthy enough to recover fully.
Instead of overwatering an entire sector, crews can deliver precise water volumes exactly where the data indicates hidden stress.
By catching dehydration at this pre-symptomatic stage, cities can optimize their recycled water networks during peak summer months.
This data-driven approach transforms urban forestry from a reactive guessing game into a precise, predictive science.
Scanning Large Ecosystems with Aerial Data
Landscaping crews cannot manually inspect millions of scattered plants efficiently across a vast desert metropolis.
When trees are distributed along highways, within residential neighborhoods, and across massive public parks, sending personnel on foot or in vehicles creates an impossible logistical bottleneck.
Ground teams can only inspect a tiny fraction of the forest canopy each day, completely missing trees that are blocked by urban structures or difficult terrain.
Data Collection Across Urban Forests
To bridge this operational gap, municipal teams replace slow ground checks with automated flight operations.
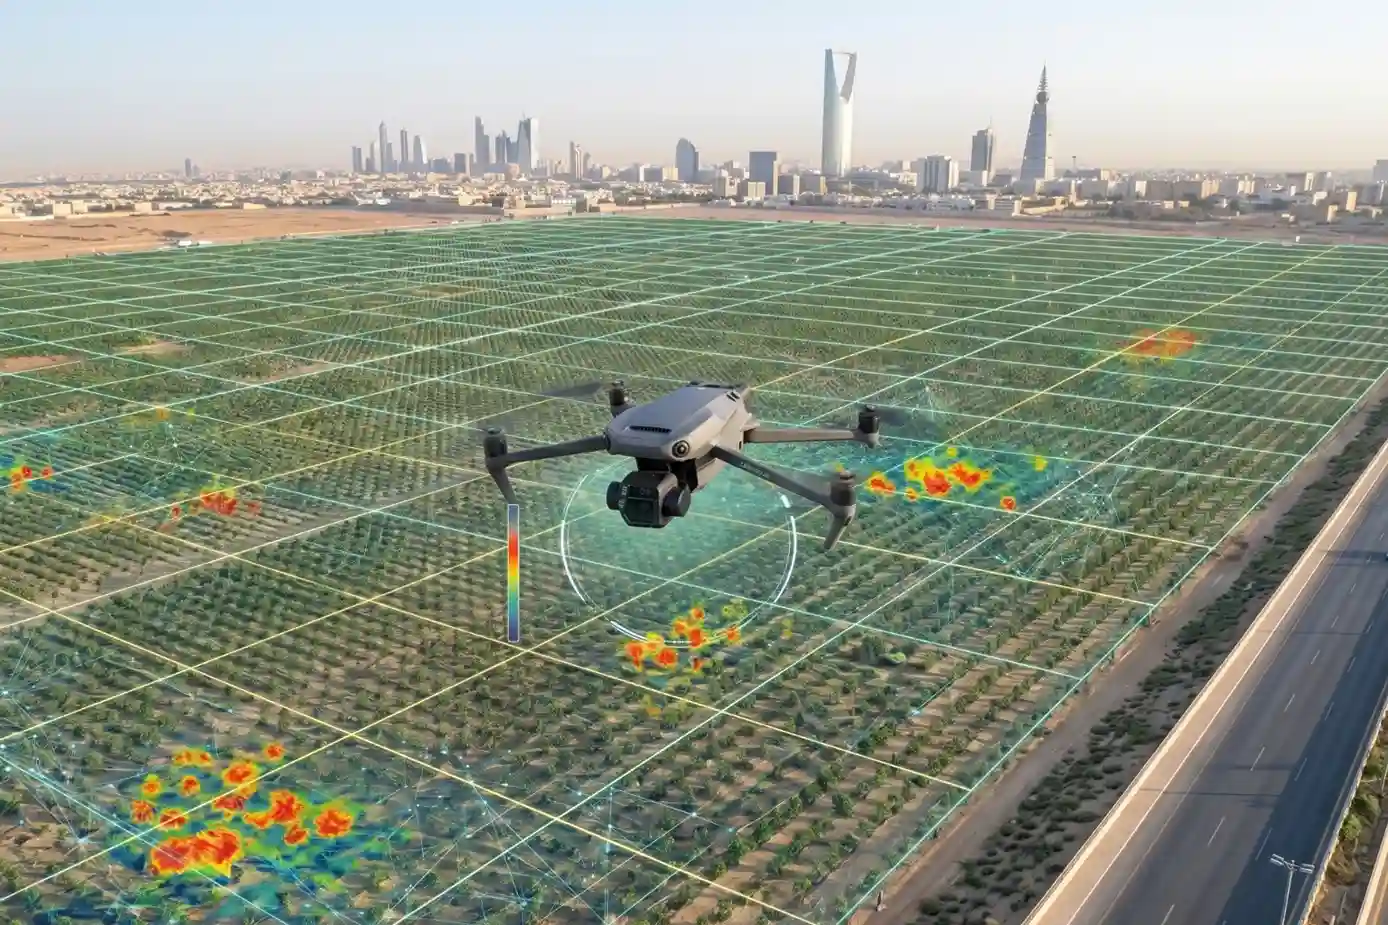
A single automated flight of DJI Mavic 3 Multispectral covers up to 200 hectares of land in a single cruise, letting operators map massive municipal parks in minutes.
This speed allows city managers to scan entire urban sectors on a regular weekly schedule, ensuring that no pocket of vegetation goes unmonitored during the hottest months of the year.
DJI Mavic 3 Multispectral flies along pre-programmed flight paths, maintaining a consistent altitude to ensure uniform image scaling.
By capturing overlapping images from above, the drone removes human bias and inconsistent note-taking from the collection process.
This automated approach creates a standardized database of the city’s green assets that can be analyzed systematically by software over time.
Deconstructing the Multispectral Sensor
The capability to monitor plant health from the air relies directly on specialized light filtration.
During operations, the hardware combines a standard 20MP visual camera with four separate 5MP narrow-band multispectral sensors (Green, Red, Red Edge, and Near-Infrared) to look past visual limits and generate NDVI vegetation index maps.
While the standard visual camera records a familiar high-resolution photographic view of the park, the four narrow-band sensors isolate specific light wavelengths that indicate biological activity.
- Green and Red Sensors: These channels measure the light absorbed and reflected by plant chlorophyll. Healthy leaves absorb large amounts of red light to fuel photosynthesis, while damaged or under-watered leaves reflect more red light as their internal chemical processes slow down.
- Red Edge and Near-Infrared Sensors: These channels are highly sensitive to the physical structure of the cells inside the leaf. When a plant is well-hydrated, its cellular walls reflect high volumes of near-infrared light. When a plant begins to lose water, these cell walls collapse slightly, causing near-infrared reflection to drop sharply.
Translating Pixels into Precision Irrigation Maps
Once the drone completes its flight, specialized mapping software processes the raw spectral images to compile a unified, geographically accurate map called an orthomosaic.
The software automatically applies the Normalized Difference Vegetation Index (NDVI) formula, which mathematically compares the ratio of near-infrared light reflection to red light absorption across every pixel of the map.
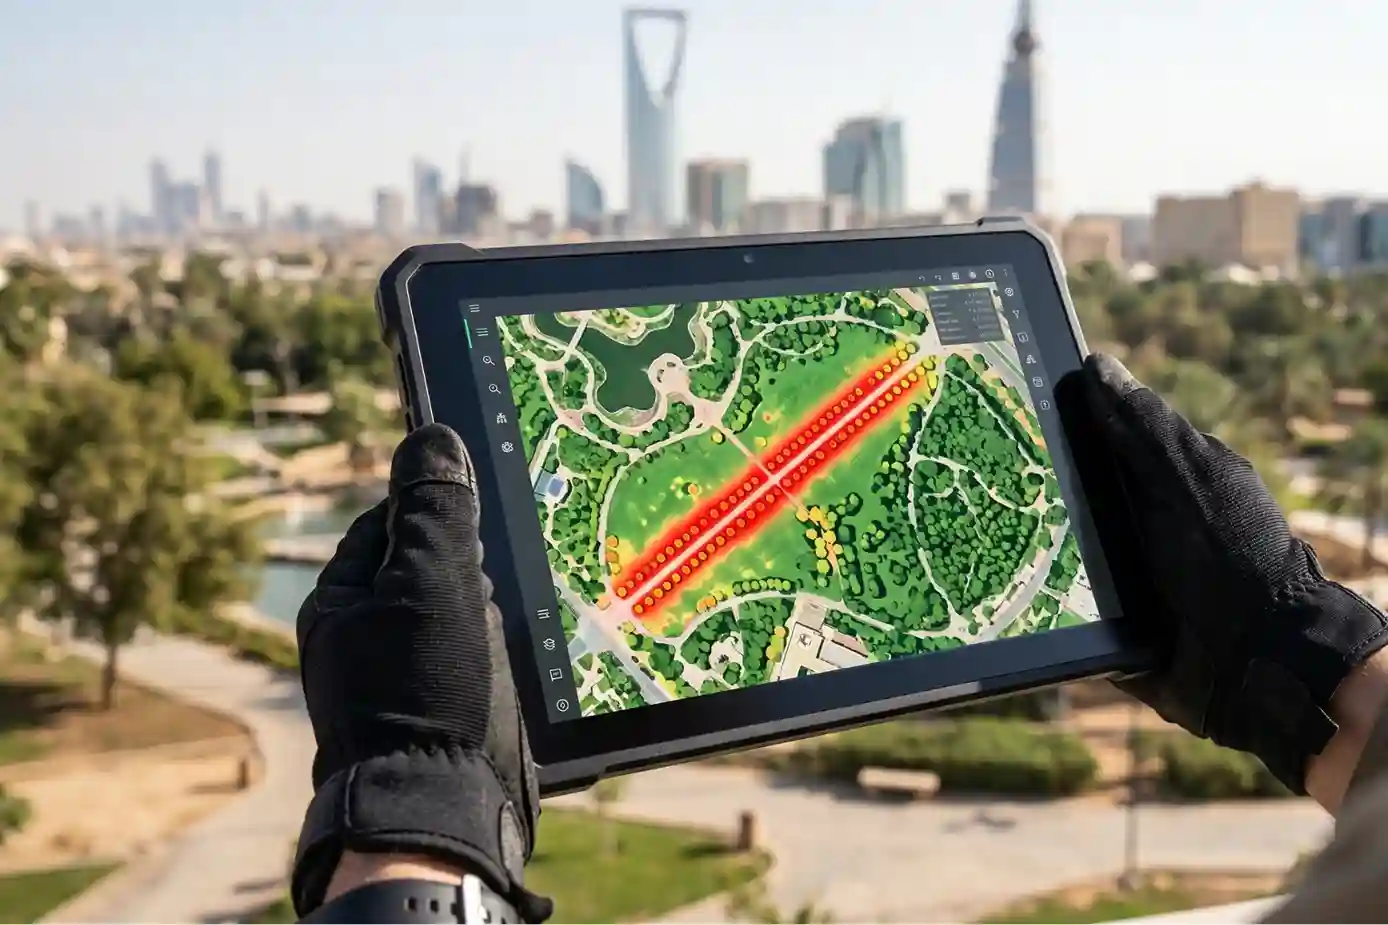
The resulting digital maps provide clear, color-coded evidence of crop health across the entire urban forestry network.
Instead of looking at millions of identical-looking green trees, engineers see a clear diagnostic chart where bright green highlights thriving vegetation, yellow indicates early cell wall degradation, and red identifies severe dehydration.
Civil engineers use these precise coordinates to optimize water infrastructure and prevent resource depletion.
If an NDVI map shows a straight line of yellow or red trees winding through a park, technicians know immediately that an underground drip irrigation pipe is blocked or broken.
This targeted data allows cities to deploy maintenance crews to the exact spot of the failure, eliminating water waste while keeping the urban canopy alive.
Help The Trees Survive This Summer
Multispectral drone tracking into your asset management workflow stops tree mortality before it spreads.
Don’t wait for trees to turn brown before taking action introduces unnecessary financial and ecological risk.
This proactiveness keeps your municipal water utility budgets on track and secures long-term environmental goals.
Consult with our expert to start aerial vegetation mapping across your municipal development zones.