
Building high-voltage power lines requires absolute spatial accuracy across long distances. In this project, an infrastructure corridor spanning 37 kilometers needed to be mapped to identify potential design clashes before construction teams arrived on-site.
The route crossed clear areas as well as complex intersections with existing overhead lines, telecom towers, roads, and buried pipelines.
If the survey failed to capture the exact elevation changes or missed a single overhead obstacle, the new transmission towers could face structural alignment issues.
Traditional, uncalibrated tools could easily cause coordinate drift over such a long distance, leading to expensive design changes and delays.
The Solution: Multi-Sensor Ground Diagnostics and Static Baseline Anchors
To ensure absolute accuracy across the entire layout, the geomatics team deployed a dedicated land survey crew using calibrated ground sensors and satellite positioning networks.
Main Reference Benchmark ➔ 5 Static Reference Monuments ➔ 39 RTK Benchmarks ➔ 3D Obstacle Map
Phase 1: Setting up Control Benchmarks
The project began by anchoring the coordinate system to an official regional benchmark. From this point, the crew installed long-term reference marks:
- Permanent Reference Monuments (PRMs): Built every 10 kilometers using cemented 3-inch PVC pipes buried 40 cm underground. These were measured using long static sessions with high-precision GNSS equipment to connect with GPS, GLONASS, Galileo, and BeiDou satellite networks, ensuring sub-centimeter accuracy.
- Survey Benchmarks (BMs): Placed every 1 kilometer and at every turn along the corridor. These were measured using Real-Time Kinematic (RTK) methods to provide quick, reliable reference points for the construction crews.
Phase 2: Right-of-Way and Obstacle Mapping
The crew walked a 25×25 meter grid pattern across the entire 34-meter Right-of-Way (ROW) corridor.
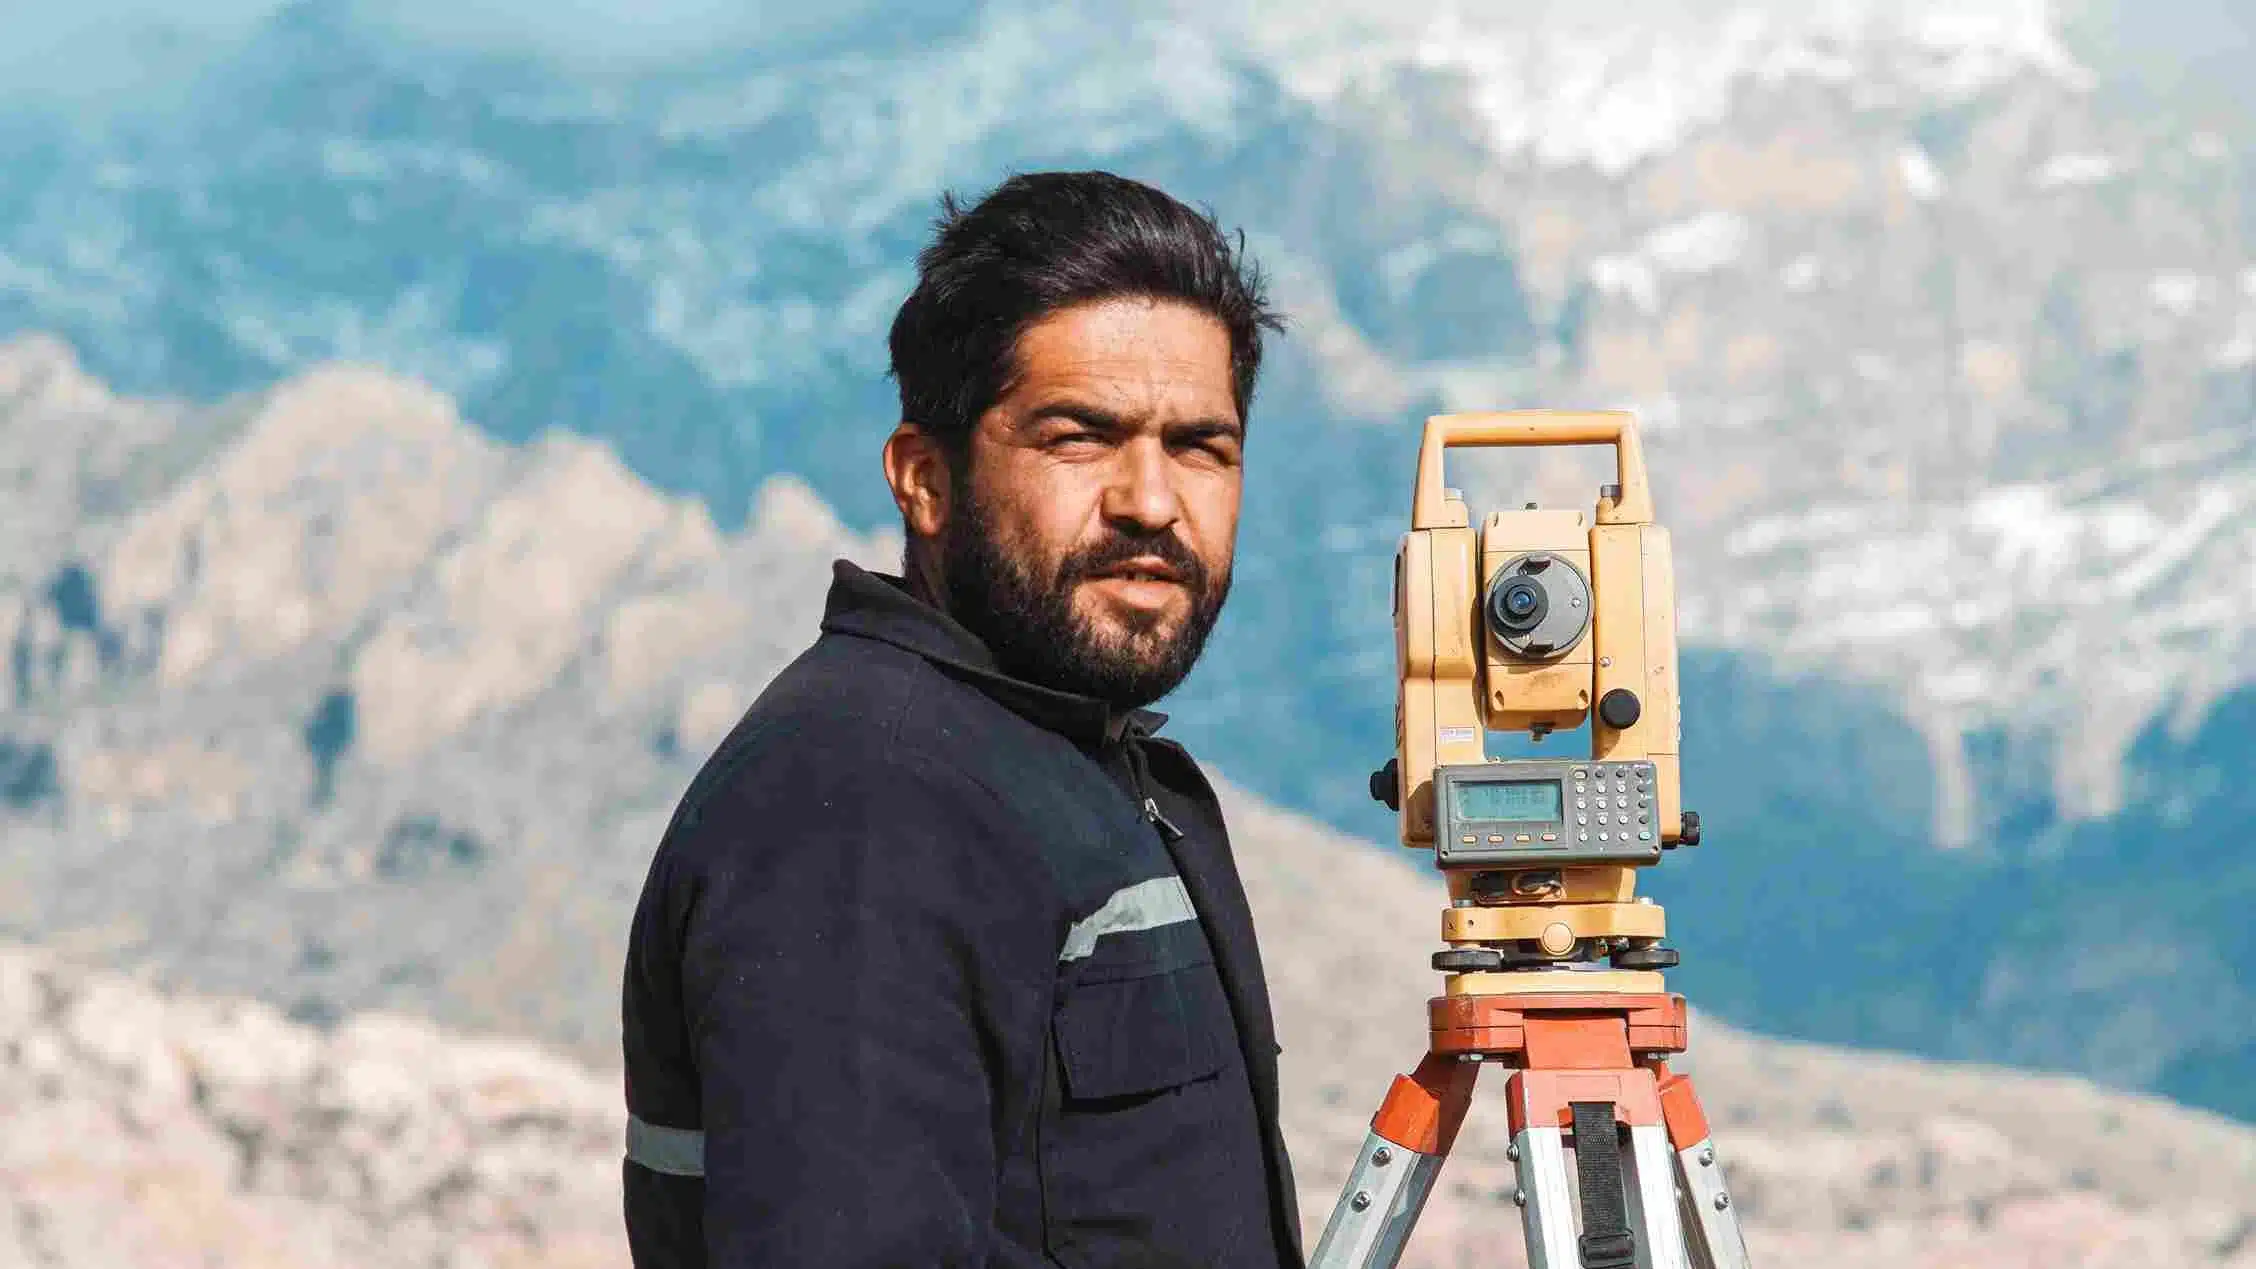
They used a Total Station to measure angles and distances in 3D for all intersecting power lines, roads, and towers.
Finally, they ran Ground Penetrating Radar (GPR) scans at 10 critical locations to locate hidden subsurface features, ensuring the ground was safe for foundation drilling.
Results & Deliverables: Clear Engineering Data
The fieldwork and office data processing were completed within the 30 working days schedule. The final topographic maps and point logs were delivered in standard industry formats:
- CSV Files: Raw coordinate lists detailing all ground points and asset locations.
- CAD Drawings: Clear 3D structural blueprints showing all surface contours, elevations, and nearby obstacles.
- XYZ Data: Detailed text files used to build digital terrain models for earthwork engineering.
By collecting high-accuracy land data before breaking ground, the construction consortium avoided spatial errors, protected their assembly schedules, and secured a reliable reference system for all future civil works.

 English